
The Data Explosion, Estimated: From 147 ZB to 10³⁷ Bits a Year
How much data will humanity produce each year in 2400? A growth curve bounded by energy, matter and the complete digital twin, and why it bends in 2111.
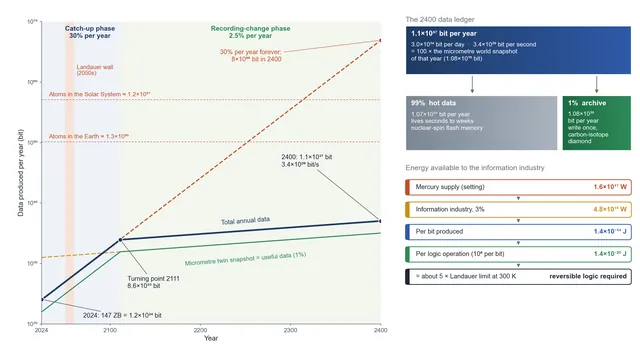
From 147 ZB a year in 2024 to about 10³⁷ bit a year in 2400, bent at 2111 by the complete digital twin.
In 2024 humanity produced about 147 zettabytes of data, and that figure has been doubling roughly every three years. Seen from the year 2400, this surge is a short phase in the history of human information. It has a beginning, a cause and an end that can be calculated.
Data does not appear from nowhere. Every bit has to be written onto some piece of matter, and every operation costs energy and sheds heat. Once data volume is put on the same ledger as energy, matter and thermodynamics, the amount of information in 2400 stops being a guess and becomes a set of numbers that anyone can check. This is the background calculation for the information world of The Digital Revolution, and several companion articles in the series use its yearly totals.
The estimate rests on three layers, and every key number in the text is labelled accordingly:
- Known physics (cannot be violated): Landauer's principle, the arithmetic of exponential growth, and the atom and energy budgets of the Solar System.
- Measurements and empirical trends: IDC's global data volume and growth rate, Koomey's law, the IEA's data-centre electricity use, and the total mass of human-made objects. These are marked as measurement or trend.
- Engineering extrapolation: two-stage growth, a 1% share of useful data, a 3% energy share for the information industry, and 10⁶ operations per bit. These are marked as assumption or setting, together with what constrains them. Elements that belong to the film's fictional setting are marked as such.
The main findings
Growth has to bend. Continued at 30% a year until 2400, annual data would reach 8×10⁶⁶ bit, about ten orders of magnitude more than the number of atoms in the Solar System.
The bend comes from the complete digital twin. In 2111 the useful data produced in one year becomes large enough to write a full micrometre-resolution snapshot of the human-made world. After that, data no longer has to catch up with an unrecorded world; it only has to record how the world changes, and growth drops to the 2.5% a year of the energy supply.
The yearly numbers for 2400. Humanity produces about 1.1×10³⁷ bit per year (3.0×10³⁴ bit per day, 3.4×10²⁹ bit per second). Of this, 1%, about 10³⁵ bit per year, goes into permanent archives. The other 99% is hot data that lives for seconds to weeks.
Irreversible computing cannot pay the bill. The information industry's energy budget in 2400 is about 4.8×10¹⁵ W. That allows 1.4×10⁻¹⁴ J for each bit produced, and about five times the Landauer limit for each logic operation. Reversible computing becomes a requirement.
Table 1. Baseline values
| Parameter | Value | Basis |
|---|---|---|
| Data produced in 2024 | 147 ZB ≈ 1.18×10²⁴ bit (10²⁴ used as the base) | Measurement (IDC) |
| Growth rate, first stage | 30% per year (2024–2111) | Trend (historical 30–40% per year) |
| Growth rate, second stage | 2.5% per year (after 2111) | Assumption: matches energy growth |
| Share of useful data | 1% | Assumption |
| Micrometre twin snapshot (2024) | 10³¹ bit, growing with human-made mass at 2.5% per year | Calculation + assumption |
| Turning-point year | 2111 | Calculation |
| Data produced in 2400 | 1.1×10³⁷ bit per year (≈ 10³⁷) | Calculation |
| Civilisation's energy ceiling in 2400 | 1.6×10¹⁷ W (total Mercury supply) | Setting shared with the Solar Grid articles |
| Information industry's energy share | 3% (about 4.8×10¹⁵ W) | Assumption (middle of the original concept's 2–4%) |
| Landauer limit at 300 K | 2.87×10⁻²¹ J per bit | Known physics |
1. The starting point: 147 ZB is a yearly flow, not a stock
IDC estimates that in 2024 the world created, captured, copied and consumed about 147 ZB of data, or about 400 million terabytes a day. In bits:
This is a year's flow. Only a small part of it is kept for long. IDC's estimates of the world's installed storage capacity are of order ten zettabytes. Most data is looked at once, processed once or forwarded once, and then it is gone. The difference between flow and stock will later call for two quite different storage technologies.
Data volumes in this article span dozens of orders of magnitude, so a common scale helps. In 2022 the General Conference on Weights and Measures added the prefixes ronna (10²⁷) and quetta (10³⁰). Names that circulated earlier, such as brontobyte and geopbyte, were never official.
Table 2. A logarithmic scale for data
| Bytes | Prefix | Bits | Comparison |
|---|---|---|---|
| 10⁹ | Giga (GB) | 8×10⁹ | One high-definition film |
| 10¹² | Tera (TB) | 8×10¹² | One personal external drive |
| 10¹⁵ | Peta (PB) | 8×10¹⁵ | Hours of processing at a large internet company |
| 10¹⁸ | Exa (EB) | 8×10¹⁸ | What humanity produced in about 3.6 minutes in 2024 |
| 10²¹ | Zetta (ZB) | 8×10²¹ | Humanity produced about 147 ZB in 2024 |
| 10²⁴ | Yotta (YB) | 8×10²⁴ | About 5×10¹⁰ drives of 20 TB, stacked into a cube about 270 m on a side |
| 10²⁷ | Ronna (RB) | 8×10²⁷ | Comparable to the number of atoms in an adult human body (about 7×10²⁷) |
| 10³⁰ | Quetta (QB) | 8×10³⁰ | Comparable to the number of bacteria and archaea on Earth (about 10³⁰ to a few times 10³⁰) |
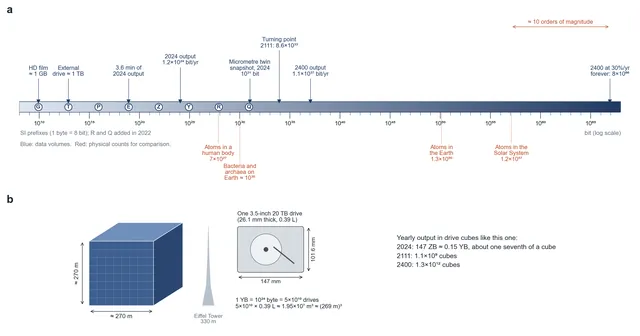
Figure 1. A logarithmic ruler for data volume. a, SI prefixes and everyday comparisons, with the yearly data volumes calculated in this article marked against physical counts. b, One yottabyte as hard drives: 5×10¹⁰ drives of 20 TB form a cube about 270 m on a side.
With a ruler in hand, the next question is how far it would have to stretch if today's growth rate never changed.
2. At 30% a year, 2400 would outnumber the atoms of the Solar System
Statistics on historical data growth from IDC and academic studies give compound annual growth rates of 30–40%. Taking the lower end, 30%, data grows exponentially:
A tenfold increase takes ln 10 / ln 1.3 ≈ 8.8 years. With the 2024 value of 1.18×10²⁴ bit:
Table 3. The no-slowdown scenario
| Year | Growth factor | Annual data | Comparison |
|---|---|---|---|
| 2140 | 1.3¹¹⁶ ≈ 1.6×10¹³ | About 1.9×10³⁷ bit (2.4×10³⁶ bytes) | About 2.4 billion RB |
| 2400 | 1.3³⁷⁶ ≈ 7.0×10⁴² | About 8×10⁶⁶ bit | The Solar System holds about 1.2×10⁵⁷ atoms |
The Solar System's atom count is essentially the Sun's mass divided by the mass of a hydrogen atom.
Even if every atom in the Solar System were made into a one-bit memory cell, it would hold only about one ten-billionth of a single year's data in 2400. Exponential growth cannot continue for 376 years. The curve has to bend somewhere.
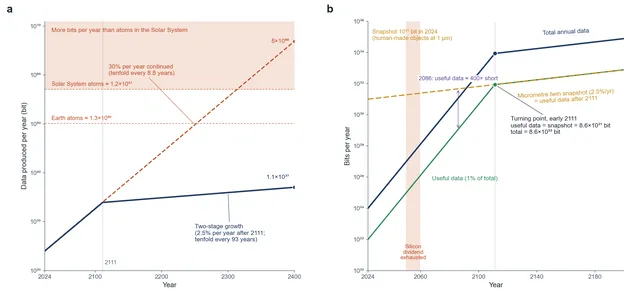
Figure 2. a, Annual data volume with 30% growth continued to 2400 (dashed) and with the two-stage growth used in this article (solid), against the number of atoms in the Earth and in the Solar System. b, Useful data (1% of the total) catches up with the micrometre digital-twin snapshot in 2111; after that the total grows at 2.5% a year.
To find where it bends, we first need to understand why growth is so fast today.
3. Why growth is so fast: machines became the main consumers of data
Before about 2010 the main consumers of data were people. Human bandwidth is limited: eight billion people can only watch and read so much in a day. Today the largest consumers of data are algorithms, and algorithms are never full. Five drivers add up:
Table 4. Five drivers of data growth
| Driver | Mechanism | Example | Fate by 2400 |
|---|---|---|---|
| Machine consumption | Data is produced for machine learning | One autonomous test vehicle: a commonly cited 4 TB a day | Continues, and becomes the bulk of the digital twin |
| Dimensional inflation | The cost of realism rises steeply with each added dimension | Text in MB, video in GB, immersive content in hundreds of GB | Converges on the precision limit of the twin |
| Jevons paradox | The cheaper storage becomes, the less anyone deletes | One film stored on 500 CDN nodes | The redundancy bubble can be squeezed out |
| Option value | "Store it now, decide later" | Every click, the torque curve of every bolt | Filtered by a threshold for useful data |
| Generative AI | Data reproduces itself; marginal cost approaches the cost of energy | Synthetic training data, games and novels generated in real time | Limited by the energy budget |
What these drivers have in common is that they copy into digital form a world that was never recorded before. For ten thousand years most streets were never photographed, most parts never measured and most conversations never kept. Today's explosive growth is a late catch-up, compensation for a recording capability that lagged ten thousand years behind.
The speed of this catch-up is set by how fast the copying proceeds, not by how fast the world changes, which is why data growth can far outrun economic growth. The catch-up will be finished one day. Before that, there is another question: why has such fast growth not consumed all the energy?
4. Why fast growth uses little electricity: Koomey's law
In 2024 the world's data centres used about 415 TWh of electricity (measurement, IEA), about 1.5% of global electricity and only about 0.24% of primary energy. Data grew more than tenfold in a decade, yet the share of electricity stayed roughly flat, because the efficiency of computing improved at the same pace. Koomey examined computers built since 1946 and found that the number of computations per joule doubled about every 1.57 years:
A doubling time of 2.6 years means efficiency improves by about 30.5% a year, which almost exactly cancels the 30% growth of data. The gap between 30% growth in data and 2.5% growth in energy has so far been filled by this efficiency dividend. The dividend came for free from making transistors smaller, and it has a physical limit.
5. The end of the dividend: the Landauer wall
In 1961 Rolf Landauer showed that erasing one bit of information must release at least this much heat to the environment, here at 300 K:
This floor does not depend on the device or its material, and it was confirmed directly by experiment in 2012. Seventy years of computing efficiency are the story of approaching this wall:
Table 5. Switching energy compared with the Landauer limit
| Era | Representative technology | Energy per switching event / Landauer limit |
|---|---|---|
| 1940s | ENIAC, vacuum tubes | About 10¹³–10¹⁶ |
| 1980s | Early microprocessors (micrometre CMOS, 5 V) | About 10⁸–10⁹ |
| 2000s | End of Dennard scaling | About 10⁵–10⁶ |
| 2020s | 3 nm CMOS, gate switching about 10⁻¹⁷ J | About 3.5×10³ |
Order-of-magnitude estimates from typical node capacitance and supply voltage (CV²). The 2020s value takes the optimistic end of published estimates, which reach about 10⁻¹⁶ J.
From 3,500 times down to the Landauer limit takes log₂(3500) ≈ 11.8 doublings, or 13.3 if today's gates are nearer 10⁴ times the limit. At one doubling every 2.6 years that is 31–35 years, which brings us to the late 2050s. In practice the wall arrives earlier. For irreversible logic to reach an error rate of 10⁻¹⁸, each switching event needs at least $k_{B}T\ln(10^{18})\approx41\,k_{B}T$, about 60 times the Landauer limit, or 1.7×10⁻¹⁹ J. Today's gates are only about 58 times above this reliability floor: about six doublings, or 15 years.
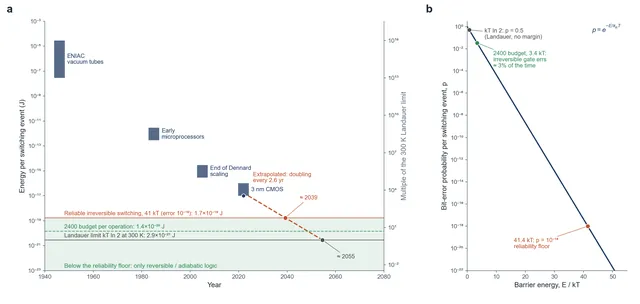
Figure 3. a, Energy per switching event from the vacuum tube to 3 nm CMOS (bands show the order-of-magnitude ranges of Table 5), extrapolated at one doubling of efficiency every 2.6 years until it meets the reliability floor for irreversible logic around 2040 and the Landauer limit in the late 2050s. b, Minimum barrier energy for a given bit-error probability, $E=k_{B}T\ln(1/p)$: an error rate of 10⁻¹⁸ needs about 41 $k_{B}T$.
The efficiency dividend of conventional silicon runs out somewhere between 2040 and 2060; we take the 2050s. From then on, if the way computers work does not change, the growth of computing power is locked to the 2.5% annual growth of energy.
6. A new engine: successive growth curves
The growth of any single technology follows an S-curve: a slow start, acceleration, and finally an approach to its own ceiling. Moore's law and Koomey's law are both S-curves. Long-run exponential growth has never been one curve followed to the end. When one curve nears its top, the next takes over: vacuum tubes gave way to transistors, and planar transistors to fin transistors.
The next curve beyond the Landauer wall is computing that does not erase information. Landauer's cost is charged only for erasure. If the logic itself is reversible, there is no fundamental lower limit at $k_{B}T\ln2$. In the film's setting, computers after 2050 have three parts:
Table 6. Computers after the 2050s (setting)
| Part | Technology | Problem solved |
|---|---|---|
| Core | Superconducting reversible logic, with interconnects of a metallic-hydrogen-based alloy that needs no cryogenic cooling (setting) | Erasure heat and Joule heating in wires |
| Coprocessor | Quantum chips | Problems that explode exponentially for classical algorithms, such as molecular simulation |
| Interconnect | Photonic circuits | Transmission power between chips and between data centres |
The room-temperature superconductor in the core is the metastable metallic hydrogen of the series. The reversible core is the subject of Reversible Computing, and the photonic side of Optical Computing GPU.
How much room is left today? In 2024 data centres used about 1.5×10¹⁸ J. Erasing all 1.18×10²⁴ bit produced that year once, at the Landauer limit, would take about 3.4×10³ J, a gap of about 4.4×10¹⁴. This gap includes the computation itself, static power, redundant transmission and cooling, and all of it is "generalised Koomey headroom" that new kinds of computers can mine. The energy side therefore has room. Where demand ends depends on how finely humanity wants to copy its world.
7. Where demand ends: the complete digital twin
Digital twins can be sorted into three levels of precision:
Table 7. Three levels of digital twin
| Level | Content | Data volume | Feasibility |
|---|---|---|---|
| Behavioural twin | Social, consumption and movement records plus round-the-clock video for 8 billion people, 100 TB per person per year | 6.4×10²⁴ bit per year | About five times today's annual output |
| Mind twin | Connectome of each brain: about 8.6×10¹⁰ neurons and 10¹⁴ synapses | 10¹⁶–10¹⁷ bit per person | Possible as a "connectome snapshot" |
| Physical twin | Position, momentum and spin of every atom, about 1,000 bit per atom, about 7×10²⁷ atoms per person | 7×10³⁰ bit per person, about 6×10⁴⁰ bit for all humans | Not feasible: a complete physical twin is the world itself |
The mind twin needs a caveat. A connectome is the structure of a brain. Whether consciousness is determined by structure alone, and whether it can be quantified at the atomic level, are open questions. The "mind backup" of the setting is therefore a connectome snapshot, not a copy of a mind.
What is really needed is a twin of the whole human world at the scale of a civilisation: every industrial part, the texture of every leaf, the path of every transaction. Start with an estimate at millimetre precision, layer by layer:
Table 8. A millimetre-scale twin of civilisation
| Layer | Estimate | Data volume |
|---|---|---|
| Static layer (geometry and materials) | Effective surface 10¹⁵ m² (the active 10% of land × 50 for interior surfaces), 10⁶ points per m² × 128 bit | 1.3×10²³ bit |
| Industrial layer (CAD/BIM) | 10¹⁰ complex industrial objects × 100 GB | 8×10²¹ bit |
| Dynamic layer (sensors and logs) | 10¹² sensors × 1 KB/s × 1 year | 2.5×10²³ bit per year |
| Physics-simulation layer (voxels) | Active volume 3×10¹⁶ m³, 1 cm voxels, about 33 bit per voxel | 1.0×10²⁴ bit |
| Total | About 1.4×10²⁴ bit |
All inputs are assumptions chosen for order of magnitude; the effective surface is 7.5×10¹⁴ m² before rounding.
A millimetre-scale twin is only of order 10²⁴ bit, about the same as one year's output today. But star gates, chips and metallic-hydrogen crystals need micrometre precision or finer. Raising everything to micrometres is not feasible: going from millimetres to micrometres multiplies a surface model by 10⁶, and going from centimetre to micrometre voxels multiplies a volume model by 10¹². A whole-volume micrometre model would reach about 10³⁶ bit.
The reasonable approach is to model only human-made objects at micrometre resolution. In 2020 the total mass of human-made objects was about 1.1×10¹⁵ kg (measurement, Elhacham et al.), already about equal to the dry mass of all living things on Earth. At a mean density of about 2.2 t/m³ that is a volume of about 5×10¹¹ m³. At one 1 μm³ voxel each, with 20 bit per voxel (assumption):
The natural environment stays at millimetre to centimetre resolution. Even if every surface were recorded at micrometre resolution, that would add only about 1.3×10²⁹ bit, which does not dominate. A complete micrometre snapshot of the world in 2024 is therefore about 10³¹ bit. The stock of human-made objects grows with the economy, so the snapshot is assumed to grow by about 2.5% a year.
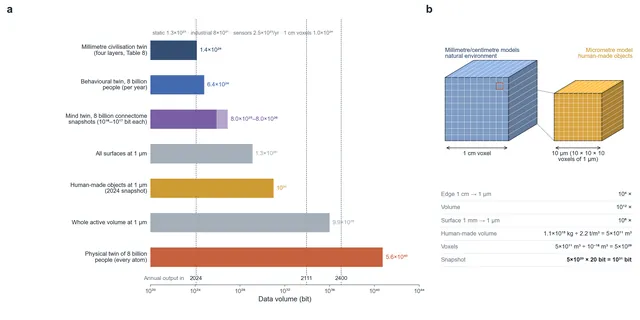
Figure 4. a, Data volume of the twins in Tables 7 and 8 on one logarithmic axis, compared with yearly output in 2024, 2111 and 2400. b, Why resolution is expensive: a 1 cm voxel holds 10¹² voxels of 1 μm, and the 5×10¹¹ m³ of human-made objects at 1 μm and 20 bit per voxel gives 10³¹ bit.
The end point of demand is now fixed. Next: when does supply catch up with it?
8. The turning point: 2111
Of today's 10²⁴ bit, well under 1% is useful data of lasting value. Take useful data as 1% of the total, growing at 30% a year, and the twin snapshot as 10³¹ bit, growing at 2.5% a year. The two are equal when:
In 2111 the useful data that civilisation produces in one year is just enough to write one complete micrometre snapshot of the world. That year, the catch-up ends. From then on new data only has to record how the world changes, and the world changes at the pace set by the growth of human-made objects and of energy, about 2.5% a year. The compensation phase is over, and the growth of information is back in step with the growth of society.
Table 9. Two-stage timeline (annual data)
| Year | Annual data | Milestone |
|---|---|---|
| 2024 | 10²⁴ bit | 147 ZB; useful data about 10²² bit |
| 2051 | 10²⁷ bit | Bits per year approach the number of atoms in a human body |
| 2077 | 10³⁰ bit | Bits per year approach the number of bacteria on Earth |
| 2050s | Silicon efficiency dividend exhausted; reversible computing takes over | |
| 2086 | 10³¹ bit | Total output reaches the 2024 size of the micrometre snapshot (useful data is still about 400 times short of that year's snapshot) |
| 2111 | 8.6×10³³ bit | Turning point: useful data = twin snapshot = 8.6×10³¹ bit |
| 2119 | 10³⁴ bit | Growth now 2.5% a year |
| 2212 | 10³⁵ bit | Tenfold growth about every 93 years |
| 2306 | 10³⁶ bit | |
| 2400 | 1.1×10³⁷ bit | 3.0×10³⁴ bit per day, 3.4×10²⁹ bit per second |
All values are calculations from the two growth rates above, starting from 10²⁴ bit in 2024. After 2111 the total is 100 times the snapshot.
The turning point also has to pass an energy check. Had computing efficiency stayed at its 2024 level, producing the data of 2111 would take about 3.3×10²⁰ W, about 1,900 times all the sunlight that reaches the Earth.
9. The energy ledger: how many joules each bit can have in 2400
The energy available to civilisation in 2400 is capped by the total Mercury supply of 1.6×10¹⁷ W (setting). Mercury is close to the Sun, so each square metre receives about 6.7 times the sunlight it would at Earth, but its cross-section is only about 15% of Earth's. The two factors nearly cancel, and Mercury intercepts about 1.7×10¹⁷ W of sunlight, almost the same as the Earth. In the setting's Mercury solar rings project, the collecting area is about four Mercury cross-sections (the planet's surface plus three rings), which intercept about 6.8×10¹⁷ W. With an end-to-end conversion efficiency of about 24% this gives 1.6×10¹⁷ W, all counted here as energy available to humanity. The power is delivered across the Solar System by gamma-ray beams. As a cross-check, 2024's primary energy of about 19.7 TW, grown at 2.5% a year for 376 years, gives about 2.1×10¹⁷ W, the same order of magnitude. The information industry's share is set at 3% (assumption):
In 2024 each bit produced cost about 1.3×10⁻⁶ J of data-centre electricity on average, so by 2400 that has to improve by about 9×10⁷. This factor is far smaller than the 4.4×10¹⁴ of headroom found in Section 6, so the 2111 turning point and the roughly 10³⁷ bit of 2400 are affordable in energy terms.
But the energy has to be spent on computation. Today each bit of data produced involves, by rough estimate, about 10⁵–10⁶ logic operations, because the traffic inside a computation is far larger than its result (assumption). Taking 10⁶, 2400 needs about 3.4×10³⁵ operations per second, and each operation's budget is:
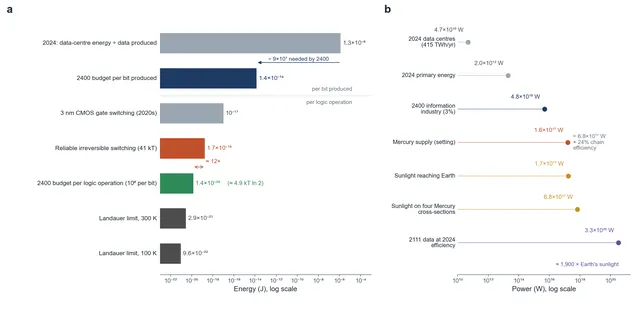
Figure 5. a, The energy ladder per bit and per logic operation. The 2400 budget per operation lies below the reliable-switching floor of irreversible logic and only about five times above the Landauer limit at 300 K. b, The power budget: from 2024 data centres to the setting's 1.6×10¹⁷ W Mercury supply, with the 3% information-industry share and the power that 2111 would need at 2024 efficiency.
The reliability floor for irreversible logic, about 60 $k_{B}T\ln2$, is about twelve times this budget. Irreversible computing cannot pay the bill for 2400. Reversible, adiabatic computing is a requirement, and rejecting heat at 100 K instead of 300 K, for example to deep space, would save another factor of three. This is the problem that the Reversible Computing article takes up.
10. The data ledger for 2400: 1% permanent, 99% transient
The 10³⁷ bit produced each year fall into two classes by lifetime, and they need completely different storage technologies:
Table 10. Two lifetimes of data in 2400
| Class | Share | Per year | Per day | Storage technology |
|---|---|---|---|---|
| Useful data (permanent archive) | 1% | 1.1×10³⁵ bit | 3.0×10³² bit | Carbon-isotope read-only storage |
| Hot data (computation traffic and caches) | 99% | 1.1×10³⁷ bit | 3.0×10³⁴ bit | Nuclear-spin flash memory, resident for seconds to weeks |
Hot data averages about 3.4×10²⁹ bit/s; the permanent archive grows by about 3.4×10²⁷ bit/s.
The yearly volume of useful data equals that year's twin snapshot (1.08×10³⁵ bit): each year the civilisation writes itself one complete micrometre archive. The two storage technologies are described in Carbon-Isotope Diamond Archive and Nuclear-Spin Memory.
What is all this data? By volume, almost all of it comes from machines: sensor logs from industrial twins, intermediate results of physics simulations, and communication between machines. Data about people themselves is negligible in volume, yet it is the most valuable part:
Table 11. Volume of human-related data (2400, 10 billion people)
| Content | Per person | All people per day | Share of daily output | Share of daily archive |
|---|---|---|---|---|
| Full-sensory log (sight, sound, touch, round the clock) | About 10¹⁰ bit/s | About 8.6×10²⁴ bit | About 3×10⁻¹⁰ | About 3×10⁻⁸ |
| Connectome snapshot (once a day) | About 4×10¹⁶ bit (5 PB) | About 4×10²⁶ bit | About 1.4×10⁻⁸ | About 1.4×10⁻⁶ |
The sensory data rate is an assumption for raw, uncompressed recording; it is far above the roughly 10⁷ bit/s that the human optic nerve carries.
Even if every person's sensory record and daily brain snapshot were archived permanently, they would fill only about one millionth of each day's archive. A single day of output in 2400 is about 15 times all the data humanity produces from 2024 to 2100. Any one person's life can be kept whole in the civilisation's archive.
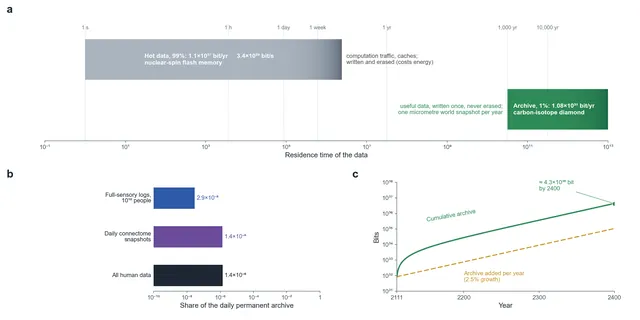
Figure 6. a, Data produced in 2400 split by lifetime: 99% hot data lasting seconds to weeks, 1% permanent archive. b, Human-related data as a fraction of the daily archive. c, Cumulative permanent archive from 2111, reaching about 4.3×10³⁶ bit by 2400.
11. Time as the irreversible accumulation of information
One hypothesis holds that time is, at bottom, the irreversible accumulation of information. It has a clear physical anchor: records can accumulate without ever decreasing, while erasure always produces heat, and entropy increase points the same way as the arrow of time. The civilisation after 2111 has exactly this structure. Hot data is written and erased continually, and that costs energy. The permanent archive is written and never erased, growing by about 10³⁵ bit a year.
From 2111 to 2400 the archive accumulates about 4.3×10³⁶ bit, and it keeps growing at 2.5% a year. The length of the civilisation's history can be measured directly in the bits of its archive. Where these bits are written, how they last tens of thousands of years, and how they stay synchronised over distances of light-minutes to light-hours are the subjects of the following articles, starting with The Speed-of-Light Limit and The Solar System Telegraph Office.
12. Main failure modes
Table 12. Failures and responses
| Failure | Trigger | Consequence | Design response |
|---|---|---|---|
| Turning point delayed | Required twin precision underestimated (for example, more uses need nanometre resolution) | Fast growth continues after 2111 and energy use exceeds the budget | Tiered precision: refine only critical parts; generate snapshots on demand |
| Efficiency dividend runs out early | Reversible computing matures after the 2050s | The information industry must take more than 3% of energy, crowding out industry | Prioritise superconducting reversible logic and low-temperature heat rejection |
| Digital bubble not squeezed out | Redundant copies and "store it now" habits persist | Permanent archive exceeds 1%, multiplying demand for storage material | Threshold for useful data; automatic expiry of hot data |
| Heat-rejection bottleneck | Computing concentrated in hot environments | Landauer cost rises linearly with temperature | Move computing to the cold side: deep space, permanently shadowed regions |
| Misreading mind data | A connectome snapshot is treated as a copy of a mind | Ethical and legal disputes | The setting only ever says "connectome snapshot" |
The growth of human information is not a bubble that swells forever. It is a catch-up with an end. In 2111 the catch-up is finished. In 2400 the civilisation produces about 10³⁷ bit of data a year, writes 10³⁵ bit of it permanently, and spends 3% of its energy doing so. Two things have to succeed first: a computer that brings each operation close to the Landauer limit, and a memory that writes bits into atoms and keeps them for tens of thousands of years.
References and calculation basis
- IDC / Statista, Volume of data created, captured, copied, and consumed worldwide: about 147 ZB in 2024.
- IDC & Seagate, Data Age 2025: the global datasphere and installed storage capacity.
- IEA (2025), Energy and AI: data-centre electricity use of about 415 TWh in 2024.
- Energy Institute, Statistical Review of World Energy: global primary energy of about 620 EJ per year.
- J. Koomey et al. (2011), Implications of Historical Trends in the Electrical Efficiency of Computing, IEEE Annals of the History of Computing: Koomey's law.
- R. Landauer (1961), Irreversibility and Heat Generation in the Computing Process, IBM Journal of Research and Development: Landauer's principle.
- A. Bérut et al. (2012), Experimental verification of Landauer's principle linking information and thermodynamics, Nature.
- C. H. Bennett (1973), Logical Reversibility of Computation, IBM Journal of Research and Development: reversible computing.
- E. Elhacham et al. (2020), Global human-made mass exceeds all living biomass, Nature: human-made mass of about 1.1 teratonnes.
- BIPM (2022), CGPM Resolution 3: SI prefixes ronna and quetta.
- W. B. Whitman et al. (1998), Prokaryotes: The unseen majority, PNAS: number of prokaryotes on Earth.
- F. Azevedo et al. (2009), Equal numbers of neuronal and nonneuronal cells make the human brain an isometrically scaled-up primate brain, Journal of Comparative Neurology: about 86 billion neurons.
- Scienshell, Mercury solar rings and The Source of All Rivers: the 1.6×10¹⁷ W Mercury supply of the film's setting.
- Calculation basis: growth from 10²⁴ bit in 2024 (Table 3 uses 1.18×10²⁴); ln 10 / ln 1.3 = 8.78 years; reliable switching at an error rate of 10⁻¹⁸ taken as ln(10¹⁸) = 41.4 $k_{B}T$; Boltzmann constant 1.380649×10⁻²³ J/K; solar constant 1,361 W/m²; mean density of human-made objects 2.2 t/m³; 10⁶ operations per bit, a 3% energy share and 1% useful data are assumptions; full-sensory log taken as 10¹⁰ bit/s per person; one year = 3.156×10⁷ s.
Appendix A. Principal symbols
Table 13. Symbols
| Symbol | Meaning | Symbol | Meaning |
|---|---|---|---|
| $D(t)$ | Annual data volume | $g$ | Annual growth factor |
| $D_{0}$ | Data volume in the base year | $\tau$ | Doubling time of computing efficiency |
| $k_{B}$ | Boltzmann constant | $T$ | Ambient temperature |
| $E_{min}$ | Minimum heat to erase 1 bit | $P_{info}$ | Power budget of the information industry |
| $e_{bit}$ | Energy budget per bit produced | $e_{op}$ | Energy budget per logic operation |
| $D_{twin}$ | Size of the micrometre twin snapshot | $\dot{D}$ | Data produced per second |