
Above the Wind: Saturn's Flying-Wing City
A hard-science-fiction engineering study: from the failure of buoyancy to lift, layout, route, fusion power, helium-3 extraction, waste heat and the city's flight envelope
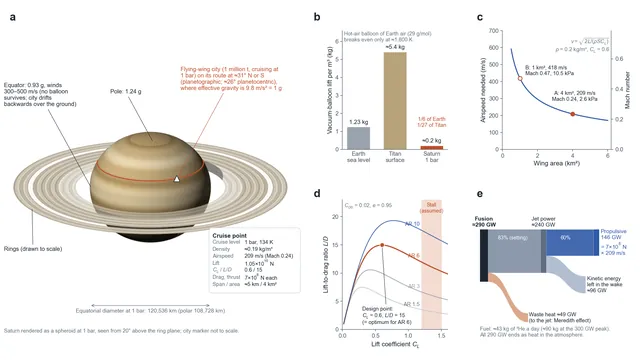
Schematic overview; panels b–e computed from the article's Tables 2, 3, 5 and 9 and Section 4.
The aerostat city on Titan lives by buoyancy: a thick nitrogen atmosphere and almost still air let huge gas bags hang quietly in the sky (see Engineering Cybernetics of the Aerostat City). On Saturn both conditions disappear at once. The atmosphere is the lightest gas mixture in the Solar System, and its winds are among the fastest. A city on Saturn cannot float. It has to fly, and it stays alive by keeping its speed.
This article is a hard-science-fiction engineering study set in the world of the Out of the Cradle series. It starts from the failure of buoyancy and works through lift, layout, route, power, helium-3 extraction and heat, ending with the city's flight envelope. The calculations are order-of-magnitude estimates, not engineering predictions, and every key number is labelled by its basis:
- Measurement: physics and observation that cannot be changed: the ideal gas law, the lift and drag equations, conservation of momentum, the Carnot limit, and the temperature, composition and winds of Saturn's atmosphere.
- Engineering experience (adopted as an assumption): lift coefficients and lift-to-drag ratios of real wings, the thickness and aspect ratio of blended-wing-body aircraft, propulsive efficiencies.
- Setting: engineering extrapolation that belongs to the fictional world: a flying structure of a million tonnes, D–³He fusion with direct energy conversion, and gas separation on the scale of a city.
Calculations are marked as such.
The main findings
Buoyancy fails on Saturn. At the 1 bar level the air density is only about 0.19 kg/m³. Even a vacuum balloon lifts at most about 0.2 kg per cubic metre: one-sixth of what it lifts on Earth and about one twenty-seventh of what it lifts at Titan's surface.
Lift solves the problem. With a 4 km² wing and a lift coefficient of 0.6, a city of a million tonnes needs an airspeed of only 209 m/s. In Saturn's hydrogen atmosphere that is about Mach 0.24.
The design point is self-consistent. A lift coefficient of 0.6 is exactly where a blended wing body of aspect ratio about 6 reaches its best lift-to-drag ratio, about 15. The drag is then 7×10⁸ N and the propulsive power about 146 GW.
The energy chain closes. About 290 GW of fusion power, with about 83% direct energy conversion (setting) and about 60% propulsive efficiency, delivers the 146 GW. The city burns about 43 kg of ³He a day.
The intake can supply the fuel. The city swallows about 220 million tonnes of atmosphere a day, which contains roughly 1,600 tonnes of ³He (more if Saturn's helium content is at the high end of current estimates). A side stream of about 130 kg/s, around 5 parts in 100,000 of the intake, is enough to refine the fuel.
Route and envelope. Effective gravity is 1 g at about 31° planetographic latitude, north or south. With its peak power the city can climb to about 0.16 bar, above the main cloud deck, and descend to 2 bar and below.
Table 1. City baseline
| Parameter | Value | Basis |
|---|---|---|
| City mass | 1 million tonnes (about ten Ford-class aircraft carriers) | Setting |
| Design lift | 1.05×10¹⁰ N (1.07 times the weight at 1 g, as a margin for manoeuvres) | Setting |
| Wing area / thickness | 4 km² / about 300 m at the central body | Setting |
| Cruise level | 1 bar, 134 K, ρ ≈ 0.19 kg/m³ (0.2 used in the design sums) | Measurement |
| Airspeed / Mach number | 209 m/s / 0.24 | Calculation |
| Lift coefficient / lift-to-drag ratio | 0.6 / 15 | Engineering experience |
| Drag / propulsive power | 7×10⁸ N / about 146 GW | Calculation |
| Intakes | Upper and lower slots, each 30 m × 1 km; 60,000 m² in total | Setting |
| Fusion power / ³He consumption | About 290 GW / about 43 kg/day | Calculation |
| Route | About 31° N or S (planetographic), effective gravity 1 g | Calculation |
1. Buoyancy fails on Saturn
The mass a gas bag can hold up equals the difference in density between the outside gas it displaces and the gas inside it:
At the 1 bar level on Saturn the temperature is about 134 K. The atmosphere is about 96% molecular hydrogen and 3% helium by volume, with a little methane, so the mean molar mass is only about 2.1 g/mol and the density about 0.19 kg/m³ (measurement). Even with a perfect vacuum inside, each cubic metre of balloon lifts at most about 0.2 kg:
Table 2. Upper limit of buoyancy per cubic metre of balloon
| Environment | Air density | Lift of a vacuum balloon | Relative to Earth |
|---|---|---|---|
| Earth, sea level | 1.23 kg/m³ | 1.23 kg | 1 |
| Titan, surface | About 5.4 kg/m³ | About 5.4 kg | About 4.4 |
| Saturn, 1 bar | About 0.19 kg/m³ | About 0.19 kg | About 1/6 |
A hot-air balloon filled with ordinary air (29 g/mol) would have to be heated until its density dropped to that of the surrounding hydrogen merely to break even, lifting nothing at all:
That is above 1,500 °C. The buoyancy limit is already too low to support a city, and Saturn's winds make it worse.
2. Wind leaves no place for a balloon, but makes lift possible
Near Saturn's equator the winds blow at 300–500 m/s year after year (measurement). Only Neptune's winds are faster. At Titan's surface the wind is a gentle 0.3–2 m/s, slow enough for smoke to rise almost straight up. The drag of the wind on a gas bag grows with the square of the wind speed, and a giant buoyant balloon on Saturn would be blown away like a kite with a broken string.
Seen the other way round, the faster the air flows, the greater the force on a wing. Lift and drag have the same origin, the dynamic pressure:
Buoyancy depends only on density. Lift grows with the square of speed. In a thin, fast-moving atmosphere, lift is the better answer.
3. Lift: trading speed for altitude
The city of a million tonnes cruises at 1 bar. Its design lift is 1.05×10¹⁰ N, about 7% more than its weight at 1 g, as a margin for manoeuvres and gusts. With a wing area of 4 km² and a lift coefficient of 0.6, the airspeed it needs is (calculation):
That is about 750 km/h, somewhat slower than a Boeing 747 at cruise (about 900 km/h). With the measured density of 0.19 kg/m³ instead of the rounded 0.2, the answer rises by 3% to about 215 m/s; the rest of the article keeps the rounded value. In hydrogen this speed is very "slow", because sound travels fast. Saturn's gas at 134 K has a ratio of specific heats of about 1.5 (the rotation of cold hydrogen molecules is only partly excited), and the speed of sound at 1 bar is:
Table 3. Wing area and required airspeed
| Option | Wing area | Required airspeed | Mach number | Wing loading |
|---|---|---|---|---|
| A: giant wing | 4 km² | 209 m/s (750 km/h) | 0.24 | 2.6 kPa |
| B: compact | 1 km² | 418 m/s (1,510 km/h) | 0.47 | 10.5 kPa |
| Reference: Boeing 747-400 | About 525 m² | About 250 m/s (Earth) | 0.85 | About 7.7 kPa (at maximum take-off weight) |
Option A flies at only Mach 0.24, far from the sound barrier, which means good aerodynamic efficiency and little noise. Its wing loading of 2.6 kPa is a third of a 747's, well suited to flight in thin air.
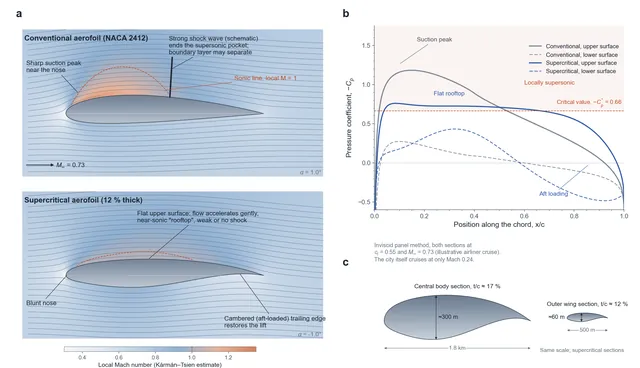
Figure 1. Conventional and supercritical aerofoils. (a) Flow around a conventional aerofoil (NACA 2412) and a 12 % thick supercritical aerofoil at the same lift, coloured by local Mach number; the dashed line is the sonic line. The conventional section develops a sharp suction peak and a large supersonic pocket ending in a strong shock; the flat upper surface of the supercritical section lets the flow accelerate gently, and its cambered trailing edge restores the lift. (b) Pressure coefficient along the chord for both sections; above the dashed critical line the flow is locally supersonic. Inviscid panel-method calculation at an illustrative airliner cruise Mach number of 0.73; the city itself cruises at Mach 0.24. (c) The city combines a blended wing body with supercritical sections: central body section (1.8 km chord, about 300 m thick, t/c about 17 %) and outer wing section (t/c about 12 %), to the same scale.
4. Lift coefficient and lift-to-drag ratio go together
Lift has a price. The drag coefficient has two parts: parasitic drag, which does not depend on lift, and induced drag, which grows with the square of the lift coefficient:
Here A is the aspect ratio and e is the span efficiency. The lift-to-drag ratio $L/D=C_{L}/C_{D}$ reaches a maximum at one particular lift coefficient:
For a thick city wing take a parasitic drag coefficient $C_{D0}=0.02$, an aspect ratio of about 6 and $e=0.95$ (engineering experience). Then $C_{L}^{*}=0.60$ and $(L/D)_{\max}=15$ (calculation). The chosen lift coefficient of 0.6 and the lift-to-drag ratio of 15 are the same optimum. A wing of aspect ratio 6 reaches this lift coefficient roughly 7–8° above its zero-lift angle, which for a cambered section means a geometric angle of attack of about 5–6°, with the flow passing smoothly over the wing. At much larger angles (say 12°) drag climbs steeply; at smaller ones there is not enough lift.
Table 4. Lift-to-drag ratios of flying machines
| Aircraft | Lift-to-drag ratio | Notes |
|---|---|---|
| Space Shuttle (subsonic glide) | About 4.5 | Engineering experience |
| Concorde (supersonic cruise) | About 7 | Engineering experience |
| F-15 | About 10 | Engineering experience |
| Boeing 747 | 15–17 | Engineering experience |
| Saturn flying-wing city | 15 | Assumption: discounted for the thick wing, surface installations and huge lift |
| B-2 (flying wing) | About 20 or more | Published estimates vary |
| Modern sailplane | 40–60 | Engineering experience |
The city does not chase a higher lift-to-drag ratio. It needs a very thick wing to hold living and industrial space, its surface carries antennas, docking ports and industrial equipment, and it has to produce a million tonnes of lift. All of these add drag. A ratio of 15 balances thickness, structure and efficiency.
5. Layout: putting a city inside a wing
The most direct way to raise the lift-to-drag ratio is a larger aspect ratio, but for a city the cost is too high. The values below are at the design lift coefficient of 0.6 with the same $C_{D0}$ and e as above:
Table 5. Choosing the aspect ratio (wing area 4 km², $C_{L}=0.6$)
| Aspect ratio | Span | Lift-to-drag ratio | Cost |
|---|---|---|---|
| 1.5 | 2.4 km | About 6.0 | Ratio too low; thrust 2.5 times higher |
| 3 | 3.5 km | About 10 | — |
| 6 | 4.9 km | About 15 | Design point |
| 10 | 6.3 km | About 19 | Large root bending moment; differences in flow between the two wings act on a long lever, making the city hard to control |
An aspect ratio of 6 means a mean chord of about 800 m, while the city needs a height of about 300 m. The blended wing body resolves this: the thickest part is concentrated in the central body, and the outer wings on either side become steadily thinner.
Table 6. Geometry of the blended-wing city
| Part | Size | Thickness-to-chord ratio | Use |
|---|---|---|---|
| Central body | Chord about 1.8 km × width about 1.2 km, height about 300 m | About 17% | About 100 storeys of living and industrial space |
| Outer wings (left and right) | Each about 1.9 km long, mean chord about 0.5 km | About 12% | Equipment, storage tanks, engines |
| Total | Span about 5 km, area about 4.1 km², aspect ratio about 6 | — | — |
The 17% thickness of the central body sits inside the 15–20% range commonly used for blended wing bodies. The city looks like a flat-topped mountain that never lands in the sea of cloud, and the wing itself is its foundation.
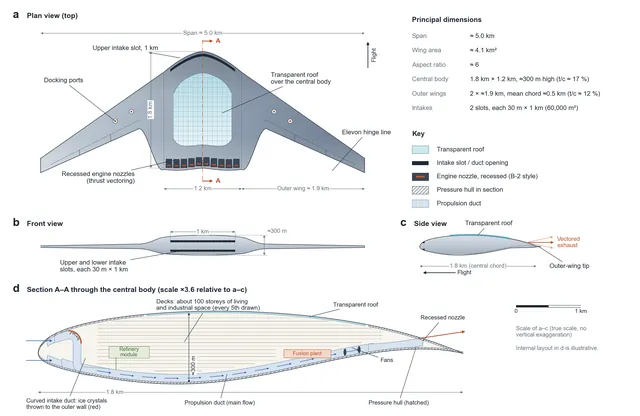
Figure 2. Three-view drawing of the flying-wing city, true scale. (a) Plan view: span about 5 km, central body 1.8 km × 1.2 km with the transparent roof, the upper intake slot along the leading edge, recessed engine nozzles in the manner of the B-2 (here with thrust vectoring), elevons and docking ports on the outer wings. (b) Front view showing the upper and lower intake slots, each 30 m × 1 km, in a central body about 300 m high. (c) Side view with the vectored exhaust. (d) Section A–A through the central body at larger scale: decks for about 100 storeys, intake ducts and the propulsion duct, fans, fusion plant and refinery module (internal layout illustrative).
6. Into the wind, at the latitude of 1 g
Lift depends only on airspeed, not on the wind. For the same airspeed, the lift and the propulsive power needed are the same whether the city flies into the wind or with it. The value of the wind lies in getting started. Measured against the rotating planet, the city's ground speed is:
On a route where the headwind is about 120 m/s (assumption), the city needs only about 89 m/s relative to the planet, about 43% of what it would need in still air. In the 400 m/s winds near the equator, the city would even have to drift "backwards" over the ground to hold 209 m/s of airspeed.
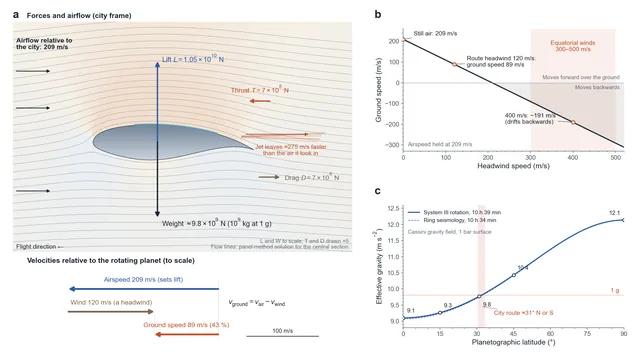
Figure 3. Flying into the wind. (a) The airspeed relative to the atmosphere (209 m/s) sets the lift of 1.05×10¹⁰ N, which balances the weight; the engine jets supply 7×10⁸ N of thrust to balance the drag. Below, to scale: with a 120 m/s headwind the ground speed is the difference between airspeed and wind, about 89 m/s (43 % of the airspeed). (b) Ground speed against headwind at a constant airspeed of 209 m/s; in the 300–500 m/s equatorial winds the city would drift backwards over the ground. (c) Effective gravity on the 1 bar surface against planetographic latitude, from the Cassini gravity field and rotation; it reaches 1 g at about 31°, the city's route.
Gravity decides the latitude of the route. Saturn is strongly flattened and rotates fast. Its equatorial radius at 1 bar is 60,268 km and its polar radius 54,364 km. At the equator the gravitational pull is weakest and the centrifugal effect of rotation strongest; at the poles there is no centrifugal effect at all. The effective gravity is the vector sum of the planet's gravity (including the extra pull of its equatorial bulge) and the centrifugal term:
Using the Cassini gravity field and the System III rotation period of 10 h 39 min gives (calculation):
Table 7. Effective gravity on the 1 bar surface
| Latitude (planetographic) | Effective gravity | Relative to Earth |
|---|---|---|
| 0° (equator) | 9.1 m/s² | 0.93 g |
| 15° | 9.3 m/s² | 0.94 g |
| 31° | 9.8 m/s² | 1.00 g |
| 45° | 10.4 m/s² | 1.06 g |
| 90° (pole) | 12.1 m/s² | 1.24 g |
Planetographic latitude is measured from the local vertical. On a planet this flattened it differs from the planetocentric latitude (the angle measured from the planet's centre) by up to about 5°: 31° planetographic is about 26° planetocentric. Using the shorter rotation period inferred from ring seismology (10 h 34 min) moves the 1 g line by less than a degree.
With the route at about 31° north or south, the people in the city feel the same 1 g as on Earth's surface. The city's own motion changes this only slightly: the largest term, from flying east or west at 89 m/s across a rotating planet, is a few hundredths of a m/s², a fraction of a percent of g.
7. Thrust and power
In steady level flight, thrust equals drag (calculation):
700 million newtons is about the thrust of 20 Saturn V first stages (five F-1 engines each) firing at full power without stopping. The 146 GW is the propulsive power that must be handed to the air continuously.
8. Intakes and propulsive efficiency
A jet produces thrust by accelerating the gas it takes in: $F=\dot{m}\,\Delta v$. The same thrust can come from a small mass of gas accelerated a lot or a large mass accelerated a little, and the second is more efficient:
Here $v_{e}=v+\Delta v$ is the exhaust speed. The intakes decide how much gas is available. The upper and lower slots, each 30 m × 1 km, total 60,000 m². At 209 m/s they take in each second:
Table 8. Propulsion options (thrust 7×10⁸ N, airspeed 209 m/s)
| Exhaust speed increase Δv | Mass flow needed | Propulsive efficiency | Jet power needed | Can the intakes supply it? |
|---|---|---|---|---|
| 100 m/s | 7.0×10⁶ kg/s | 81% | 181 GW | No |
| 200 m/s | 3.5×10⁶ kg/s | 68% | 216 GW | No |
| 275 m/s | 2.5×10⁶ kg/s | 60% | 243 GW | Just, at full capacity |
| 400 m/s | 1.75×10⁶ kg/s | 51% | 286 GW | Yes, with 30% to spare |
The best choice is to use the intakes to the full: about 2,500 tonnes of atmosphere a second, leaving about 275 m/s faster than it arrived, for a propulsive efficiency of 60%. That is about 220 million tonnes of intake a day, and it is also the throughput of the city's "gills".
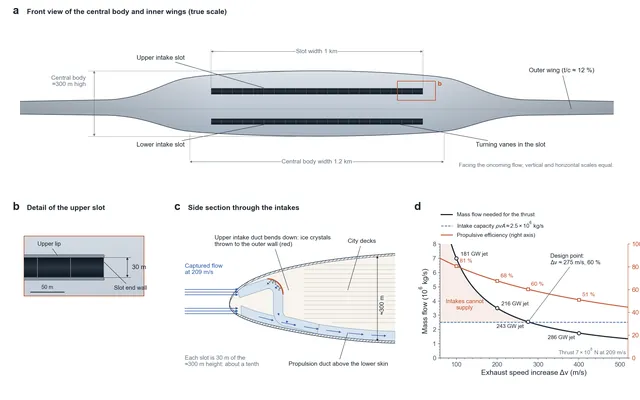
Figure 4. Front view of the intakes. (a) True-scale front view of the central body: two long, flat slots above and below, each 30 m × 1 km, that do not take up the city's height of about 300 m. (b) Detail of the upper slot. (c) Side section through the intakes: the upper intake duct bends down behind the nose, where ice crystals are thrown to the outer wall, and joins the propulsion duct above the lower skin; the city decks lie above (layout illustrative). (d) Mass flow needed for 7×10⁸ N of thrust against the exhaust speed increase, with the propulsive efficiency and jet power; the intakes can supply at most about 2.5×10⁶ kg/s, which sets the design point of Δv ≈ 275 m/s and 60 % efficiency.
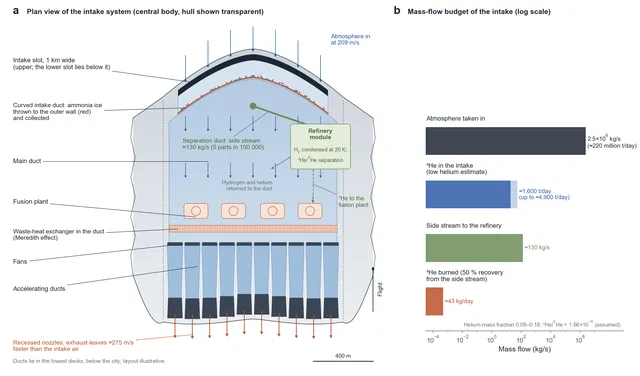
Figure 5. Top view of the intake system. (a) Plan view of the central body with the hull shown transparent: the intake slot, the curved intake duct where ammonia ice is thrown to the outer wall, the main duct, the waste-heat exchanger, fans and accelerating ducts leading to the recessed nozzles, and the separation duct that takes a side stream of about 130 kg/s to the refinery module (layout illustrative). (b) Mass-flow budget on a logarithmic scale: about 2.5×10⁶ kg/s of atmosphere, containing about 1,600 tonnes of ³He a day at the low helium estimate (up to about 4,900 tonnes); the side stream; and the 43 kg of ³He burned each day.
9. The energy chain: from fusion to thrust
The products of D–³He fusion are a proton and a helium-4 nucleus, both charged. Electromagnetic fields can slow them down and turn their kinetic energy straight into electricity, at efficiencies well above those of a heat engine. For a heat engine the theoretical ceiling is the Carnot efficiency; with a hot side at 3,000 K (assumption) and Saturn's air as the cold side:
Saturn's air at 134 K is one of the best heat sinks in the Solar System for any part of the plant that does run on heat. Taking an overall efficiency of about 83% from fusion power to fan shaft power (setting; this lumps together direct conversion, motors and fans), the energy chain is:
Table 9. Energy chain of the Wudang-class power plant (normal cruise)
| Stage | Power | Efficiency | Where the rest goes |
|---|---|---|---|
| Fusion power | About 290 GW | — | — |
| Direct energy conversion → motors and fans → jet power | About 240 GW | About 83% (setting) | About 49 GW becomes waste heat |
| Jet → propulsive power | About 146 GW | About 60% | About 96 GW stays in the wake |
"Wudang-class" is the name of the power plant in the setting.
The daily fuel consumption is (calculation, using 18.35 MeV per D–³He reaction):
The reaction also needs about 28 kg of deuterium a day, which can be taken as a by-product from the hydrogen the city swallows: at Saturn's D/H of about 2×10⁻⁵, the daily intake holds several thousand tonnes of it. The nameplate of the Wudang class could read: normal propulsive power 150 GW, peak propulsive power 300 GW, Carnot limit 95.5%. At peak the reactors must deliver about 600 GW of fusion power and burn about 90 kg of ³He a day.
10. A hydrogen-rich atmosphere is the best working fluid
For the same heating, the exhaust speed is inversely proportional to the square root of the molar mass of the working fluid:
This is why nuclear thermal rockets use hydrogen as propellant and reach specific impulses of around 900 seconds. Every second the flying-wing city takes in a first-class propellant, and it never has to carry a fuel tank for it.
11. Gills: taking helium-3 out of the air
Saturn's upper atmosphere is about 96% hydrogen and 3% helium by volume (measurement). Helium rain deep inside the planet has depleted it below the primordial value, and how far is still uncertain: estimates of the helium mass fraction range from about 0.06 (Voyager; the NASA fact-sheet composition) to about 0.18 (later reanalyses and Cassini-era studies). The ³He/⁴He ratio has not been measured at Saturn; here it is assumed to equal Jupiter's Galileo value, 1.66×10⁻⁴. At the low end of the helium range, the 220 million tonnes of daily intake contain (calculation):
The last factor converts atoms to mass (3/4). That is about 1,600 tonnes of ³He, and up to about 4,900 tonnes at the high end, while the city burns only 43 kg a day. So the city does not need to process all of its intake. With 50% recovery, a side stream of about 130 kg/s taken from the main flow (about 5 parts in 100,000 of the intake) is enough at the low helium estimate, and less is needed if Saturn holds more helium. The main flow goes on to the engines as usual.
Table 10. Two-stage separation of helium-3
| Stage | Target | Method | Basis |
|---|---|---|---|
| Intake duct | Remove ammonia ice crystals and droplets | Inertial separation in a curved duct: particles are thrown against the outer wall and collected | Engineering experience (helicopter inlet particle separators) |
| First stage | Separate helium from hydrogen | Cryogenic condensation: cooled to about 20 K, hydrogen liquefies while helium stays a gas | Engineering experience |
| Second stage | Separate ³He from ⁴He | Thermal-diffusion columns (hot wires heated by reactor waste heat, cold walls cooled by liquid hydrogen), or superfluid heat flush: ⁴He becomes a superfluid below 2.17 K | Engineering experience |
Only about 1.7 helium atoms in 10,000 are ³He; counting the hydrogen as well, only about one molecule in 190,000 is a ³He atom. This step takes place in a refinery module where the gas is nearly at rest. The cold comes from the atmosphere and liquid hydrogen, the heat from fusion waste heat. Cooling and liquefying the side stream takes of order one to a few gigawatts (estimate), less than 2% of the total power.
Saturn's ³He is plenty for the city's own needs. Per tonne of atmosphere, though, the grade is between about a quarter and three-quarters of Jupiter's, depending on which helium estimate is right, and Jupiter's helium content is measured directly. Industrial-scale ³He mining makes more sense at Jupiter (see Helium-3 in Jupiter's atmosphere).
12. Waste heat: from keeping warm to getting rid of heat
Inside, the city is kept at 20 °C. Outside is hydrogen at 134 K streaming past at 209 m/s, with a thermal conductivity about seven times that of air. With a total surface area of about 10 km² and an overall heat-transfer coefficient of 0.5 W/(m²·K) (assumption, set by the insulation):
That is only about 2% of the reactor waste heat (about 49 GW). Heating is not the problem; getting rid of heat is. The best place to put it is the propulsion stream itself. Waste heat handed to the jet adds a little more thrust, the trick known in aviation as the Meredith effect.
In the end all of the roughly 290 GW of fusion power is left in the atmosphere behind the city: the 49 GW of waste heat, the 96 GW of surplus kinetic energy in the jet, and the 146 GW of propulsive work, which the drag turns into turbulence and finally heat. In the 134 K air this makes a long, warm, buoyant wake. As it rises and cools, ammonia vapour in it can condense again, so the city may trail a churning white plume, like a plough cutting through the sea of cloud. (Water plays no part at this level: on Saturn it condenses out tens of bars deeper.)
13. Flight envelope: rising above the clouds
Turned around, the lift equation decides at which levels the city can fly. To keep the same lift, airspeed must scale with the inverse square root of the air density, and because drag stays the same, the power scales with airspeed:
Saturn's air is not isothermal. It warms with depth roughly along an adiabat below 1 bar and cools upwards to a tropopause of about 85 K near 0.1 bar. Higher up, the air is therefore denser than its pressure alone would suggest. Using a representative temperature profile (calculation; the profile is approximate):
Table 11. Flight conditions at different levels
| Pressure | Temperature | Required airspeed | Mach number | Propulsive power |
|---|---|---|---|---|
| 2 bar | About 170 K | 166 m/s | 0.17 | About 116 GW |
| 1 bar (cruise) | 134 K | 209 m/s | 0.24 | About 146 GW |
| 0.5 bar | About 106 K | 263 m/s | 0.33 | About 184 GW |
| 0.3 bar | About 99 K | 329 m/s | 0.42 | About 230 GW |
| 0.24 bar | About 96 K | 362 m/s | 0.47 | About 253 GW |
| About 0.16 bar (envelope ceiling) | About 91 K | 429 m/s | 0.57 | 300 GW (peak) |
If the temperature were 134 K at every level, the ceiling at 300 GW would be about 0.24 bar instead. The propulsive efficiency stays at about 60% along the whole line, because the intake flow and the required thrust scale together.
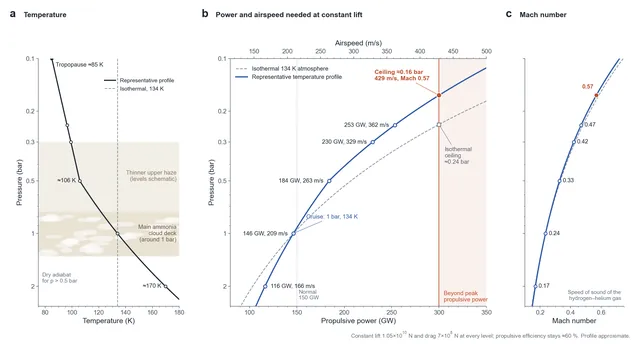
Figure 6. Flight envelope. (a) Representative temperature profile used in the calculation, with the main ammonia cloud deck around 1 bar and the thinner haze above. (b) Propulsive power and airspeed needed to keep the same lift at each pressure level. Peak propulsive power of 300 GW lets the city climb to about 0.16 bar (429 m/s), above Saturn's main cloud deck. The dashed grey line shows the result if the air had the same temperature (134 K) at every height, with a ceiling of about 0.24 bar. (c) Mach number along the same line, reaching 0.57 at the ceiling.
Saturn's main ammonia cloud deck lies around 1 bar, under a thinner upper haze. Peak power lets the city climb to about 0.16 bar, and this is the physical basis for "rising above the clouds". Sunlight at Saturn is only about 1% as strong as at Earth, but the rings reflect enough of it that, on the sunlit side, ringshine is far brighter than a full moon on Earth. From the route at about 31°, the rings stand across the sky as a broad silver arch. (From the equator itself they would be seen edge-on, as a thin line.)
Going down is another matter. The deeper the city goes, the higher the temperature, pressure, density and gravity, and its structure and heat loads quickly approach their limits. Deep inside Saturn, helium rain is thought to be one of the reasons the planet radiates about 1.8 times as much energy as it absorbs from the Sun. The city's domain is the layer above the sea of cloud.
14. Main failure modes
Table 12. Failures and responses
| Failure | Trigger | Consequence | Design response |
|---|---|---|---|
| Loss of power | Fusion reactor or fan failure | Loss of thrust, airspeed falls | Many redundant engines; glide down into denser air (at 2 bar only 166 m/s is needed) |
| Stall | Gust or manoeuvre drives the angle of attack too high | Sudden loss of lift | The lift coefficient of 0.6 is about half the stall value (assumed 1.2–1.5) |
| Wind shear | Crossing jet streams at different latitudes | Sudden change of airspeed | Route fixed at about 31°, cruising into the wind |
| Intake icing | Build-up of ammonia ice | Reduced intake flow | Inertial separators and de-icing with waste heat |
| Refinery shutdown | Separation equipment failure | Fuel supply interrupted | Fuel reserves; at 43 kg/day, months of fuel are easy to store |
| Structural fatigue | Gust loads | Cracks at the wing root | Moderate aspect ratio; continuous monitoring |
Saturn's sky has no ground to land on, and the city does not need one. As long as its power never stops, it can keep flying. Humanity's first foothold on a gas giant is not a piece of land. It is a speed.
References and calculation basis
- NASA NSSDC, Saturn Fact Sheet: radii, GM, temperature and density at 1 bar, atmospheric composition.
- Iess et al. (2019), Measurement and implications of Saturn's gravity field and ring mass, Science: zonal gravity harmonics J2, J4 and J6.
- Mankovich et al. (2019), Cassini ring seismology as a probe of Saturn's interior, ApJ: rotation period of about 10 h 34 min.
- Conrath et al. (1984) and Conrath & Gautier (2000), on Saturn's helium abundance from Voyager; Koskinen & Guerlet (2018) and Achterberg & Flasar (2020), Cassini-era estimates.
- Lindal et al. (1985), The atmosphere of Saturn: an analysis of the Voyager radio occultation measurements, AJ: temperature against pressure.
- Sánchez-Lavega et al.: observations of Saturn's zonal winds (300–500 m/s near the equator).
- J. D. Anderson, Introduction to Flight and Fundamentals of Aerodynamics: lift, the drag polar and the maximum lift-to-drag ratio.
- R. H. Liebeck (2004), Design of the Blended Wing Body Subsonic Transport, Journal of Aircraft 41: thickness and lift-to-drag ratio of blended-wing-body layouts.
- Mahaffy et al. (1998), Galileo probe mass spectrometer: Jovian ³He/⁴He of about 1.66×10⁻⁴, assumed here for Saturn.
- Scienshell, Helium-3 in Jupiter's atmosphere: helium content of Jupiter and Saturn compared.
- Calculation basis: 1 bar, 134 K, mean molar mass 2.15 g/mol (NSSDC composition), density 0.19 kg/m³ rounded to 0.2 in the design sums; ratio of specific heats about 1.5 (normal hydrogen with partly excited rotation); $C_{D0}=0.02$, aspect ratio 6, $e=0.95$; D–³He energy 5.87×10¹⁴ J per kg of ³He; 83% overall conversion efficiency is a setting value. Temperature profile: dry adiabat from 134 K at 1 bar for pressures above 0.5 bar, interpolated to an 85 K tropopause at 0.1 bar.
Appendix A. Principal symbols
Table 13. Symbols
| Symbol | Meaning | Symbol | Meaning |
|---|---|---|---|
| ρ | Air density | $C_{L}$ / $C_{D}$ | Lift coefficient / drag coefficient |
| q | Dynamic pressure | $C_{D0}$ | Parasitic drag coefficient |
| L / D | Lift / drag | K | Induced-drag factor |
| S | Wing area | A | Aspect ratio |
| v / $v_{e}$ | Airspeed / exhaust speed | $\eta_{p}$ | Propulsive efficiency |
| Q | Intake mass flow | $P_{f}$ | Fusion power |
| $g_{\mathrm{eff}}$ | Effective gravity | $e_{3}$ | Fusion energy per kg of ³He |
| γ | Ratio of specific heats | Ω | Saturn's rotation rate |